Stock Harvesting
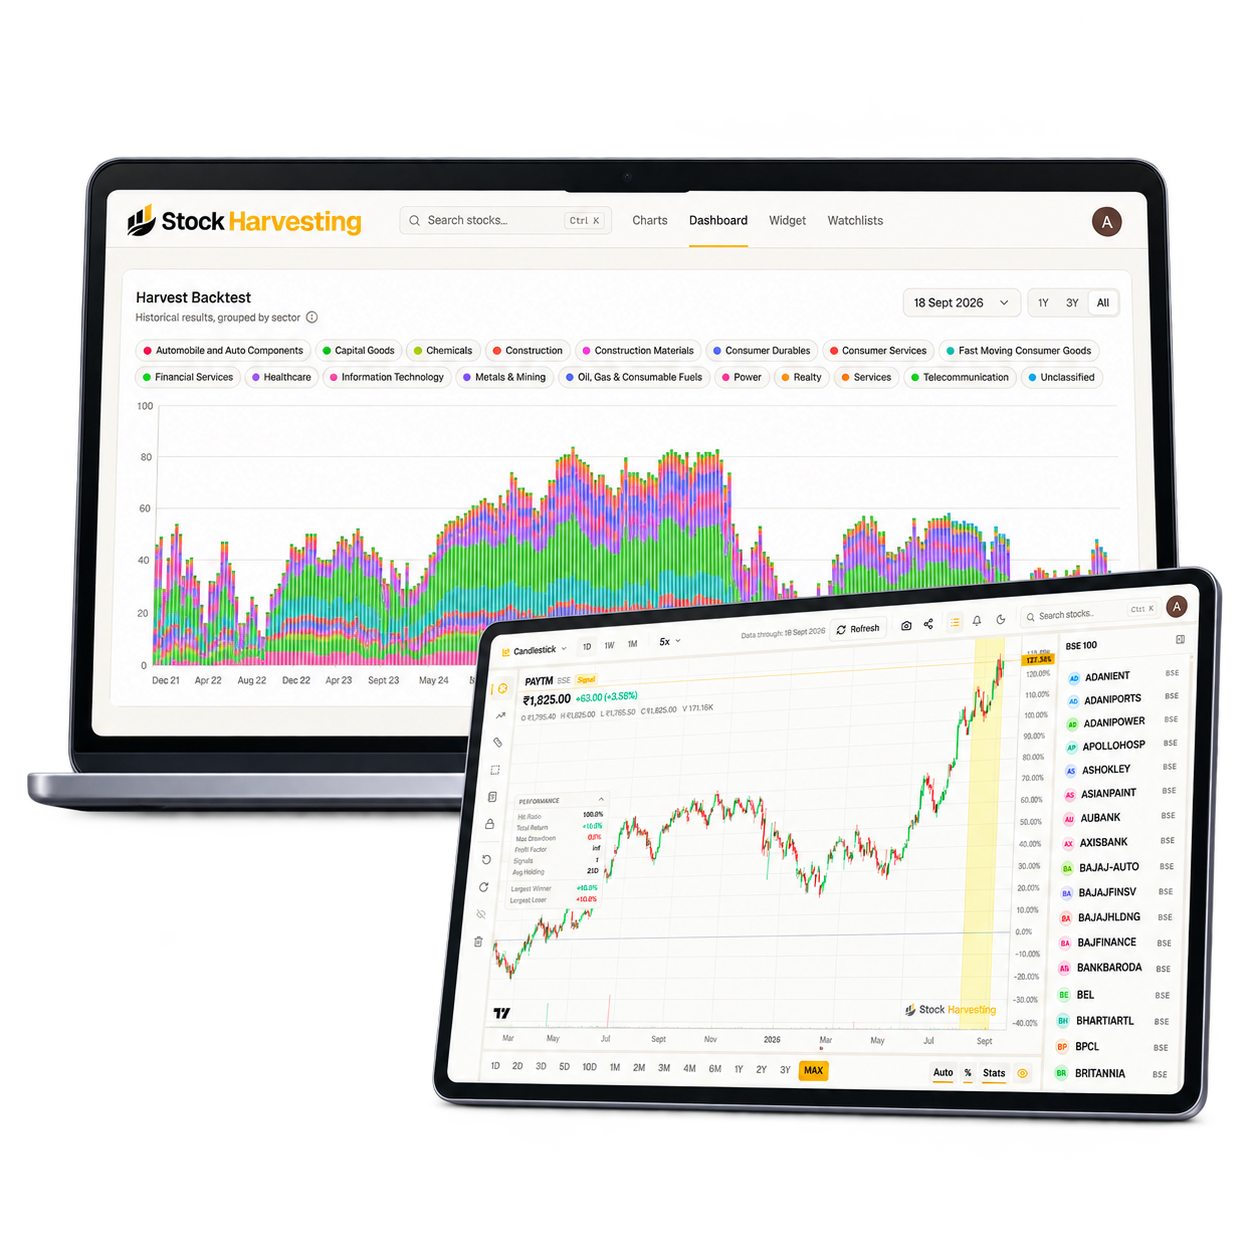
High-performance market analytics and sector backtesting platform engineered for rapid candlestick visualization and quantitative trade research.
The Challenge
Financial data interfaces often suffer from UI degradation when rendering dense historical candlestick records, real-time indicators, and multi-sector aggregates on standard viewports.
- Rendering dense time-series histories smoothly without frame drops or browser latency.
- Visualizing historical sector performance distributions across multi-year date horizons.
- Providing responsive keyboard navigation (Ctrl+K) and fast timeframe switching.
What We Built
Frontail engineered a full-stack market platform pairing canvas-based charting with a sector backtesting visualizer and structured time-series data pipelines.
- Interactive candlestick charting engine with dynamic timeframes (1D, 1W, 1M) and quantitative HUD.
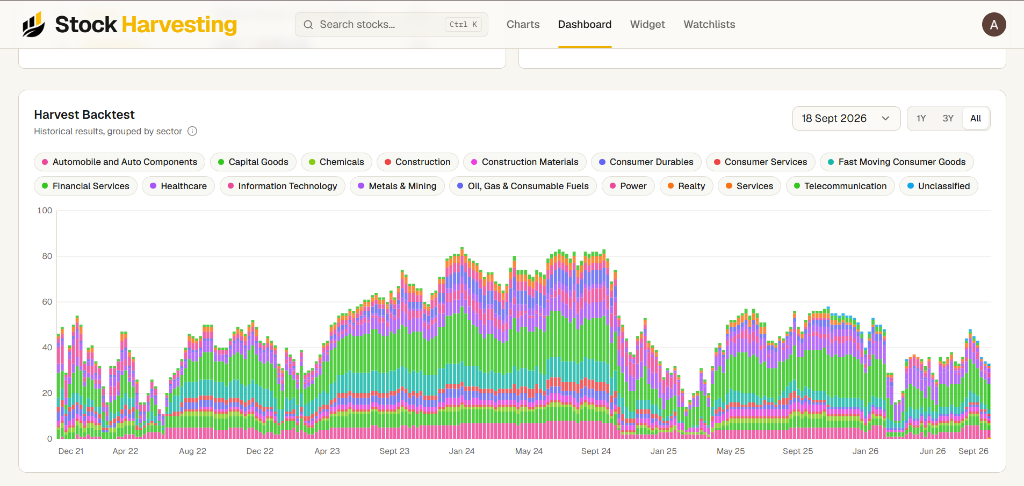
- Harvest Backtest dashboard supporting historical performance evaluation across 18 industry sectors.
- Reliable market-data synchronization layer delivering pre-indexed data payloads with low latency.
Built for Speed & Clarity
Historical Candles
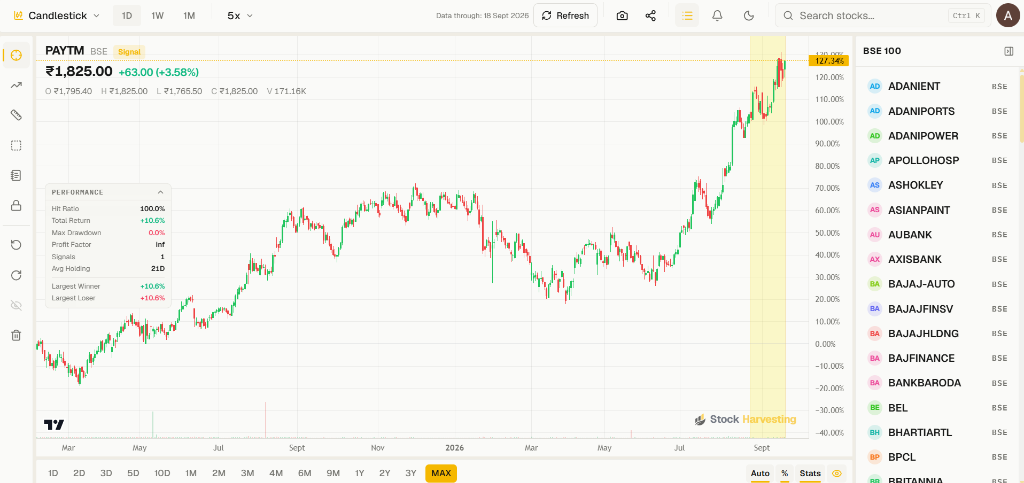
High-performance canvas charting with multi-timeframe OHLCV inspection (1D, 1W, 1M).
Signal Analysis
Direct visual trade signals with entry markers and dynamic indicator overlays.
Performance Statistics
Real-time HUD computing hit ratio, total return, profit factor, and max drawdown.
Core Engineering Modules
Trading & Charting
Canvas-powered financial charting built for active traders, supporting multi-timeframe candle toggles, dynamic cursor crosshairs, synchronized volume sub-charts, and instant keyboard navigation across BSE/NSE instruments.
Backtesting & Sector Analytics
A historical analytics engine that allows users to evaluate market signals and review performance distributions categorized across 18 distinct industry sectors over custom date horizons.
Market Data Engineering
Structured data pipelines normalize historical price data and deliver organized sector datasets to client dashboards with rapid response times.
Key Product Features
Interactive Candlestick Engine
Low-latency OHLCV charts with volume overlays, crosshairs, and multi-timeframe controls.
Harvest Backtest Dashboard
Visual stacked bar charts analyzing signal outcomes grouped across 18 industry sectors.
Curated Index Watchlists
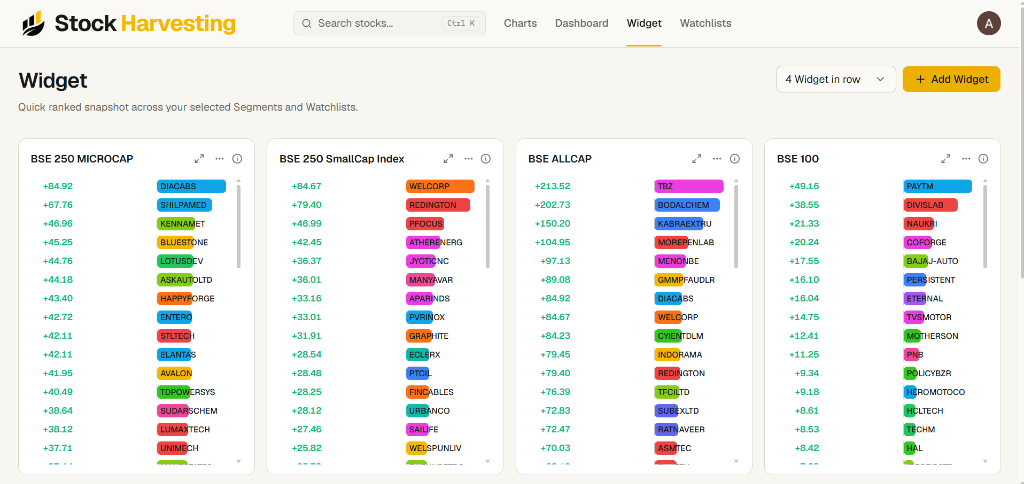
Segment-ranked market boards for BSE 100, SmallCap, MicroCap, and AllCap equities.
Global Keyboard Search
Rapid modal lookup (Ctrl+K) for instant instrument discovery across listed equities.
Quantitative Metric HUD
Real-time stats computing hit ratio, total return %, max drawdown, and trade counts.
Responsive Multi-Pane UI
Tailored analytical layout optimized for widescreen monitors and tablet viewports.
Technical Architecture
Optimized time-series storage architecture engineered to support rapid query speeds across multi-year historical datasets.
Built a reliable market-data synchronization layer designed to keep analytical datasets consistent and current.
High-performance canvas rendering pipeline designed to deliver smooth 60 FPS interactions on desktop and tablet viewports.
Technical Challenges
High-Density Chart Rendering
Rendering dense multi-year candlestick datasets alongside active indicators without browser frame drops.
Engineered canvas-based rendering with viewport slicing for seamless 60 FPS user interaction.
Multi-Sector Historical Analytics
Visualizing aggregate performance distributions across 18 industry sectors over custom date horizons.
Built an analytical processing pipeline that delivers organized historical datasets directly to visualizers.
Market-Data Synchronization
Keeping analytical datasets consistent and current without disrupting active user charting sessions.
Implemented non-intrusive background synchronization that updates underlying data while preserving UI state.
Tech Stack
What We Delivered
Interactive Market Analysis
Smooth canvas charting with multi-timeframe toggles and quantitative performance HUD.
Historical Backtesting
18-sector visual backtesting dashboard evaluating historical market signals across custom date ranges.
Segment Watchlists
Ranked market boards for BSE indices paired with global keyboard shortcuts (Ctrl+K).
Automated Data Refresh
Reliable market-data synchronization pipelines keeping analytical charts current.
Frontail Capabilities
Related Product Engineering Services
Web & SaaS Development
Build scalable multi-tenant SaaS platforms and analytics dashboards with Next.js and TypeScript.
Custom Software Development
Engineer custom internal tools, data processing pipelines, and high-performance financial systems.
MVP Development
Launch production-ready startup MVPs with clean architecture in 4 to 8 weeks.
Portfolio
More Engineering Case Studies
VoxLogix
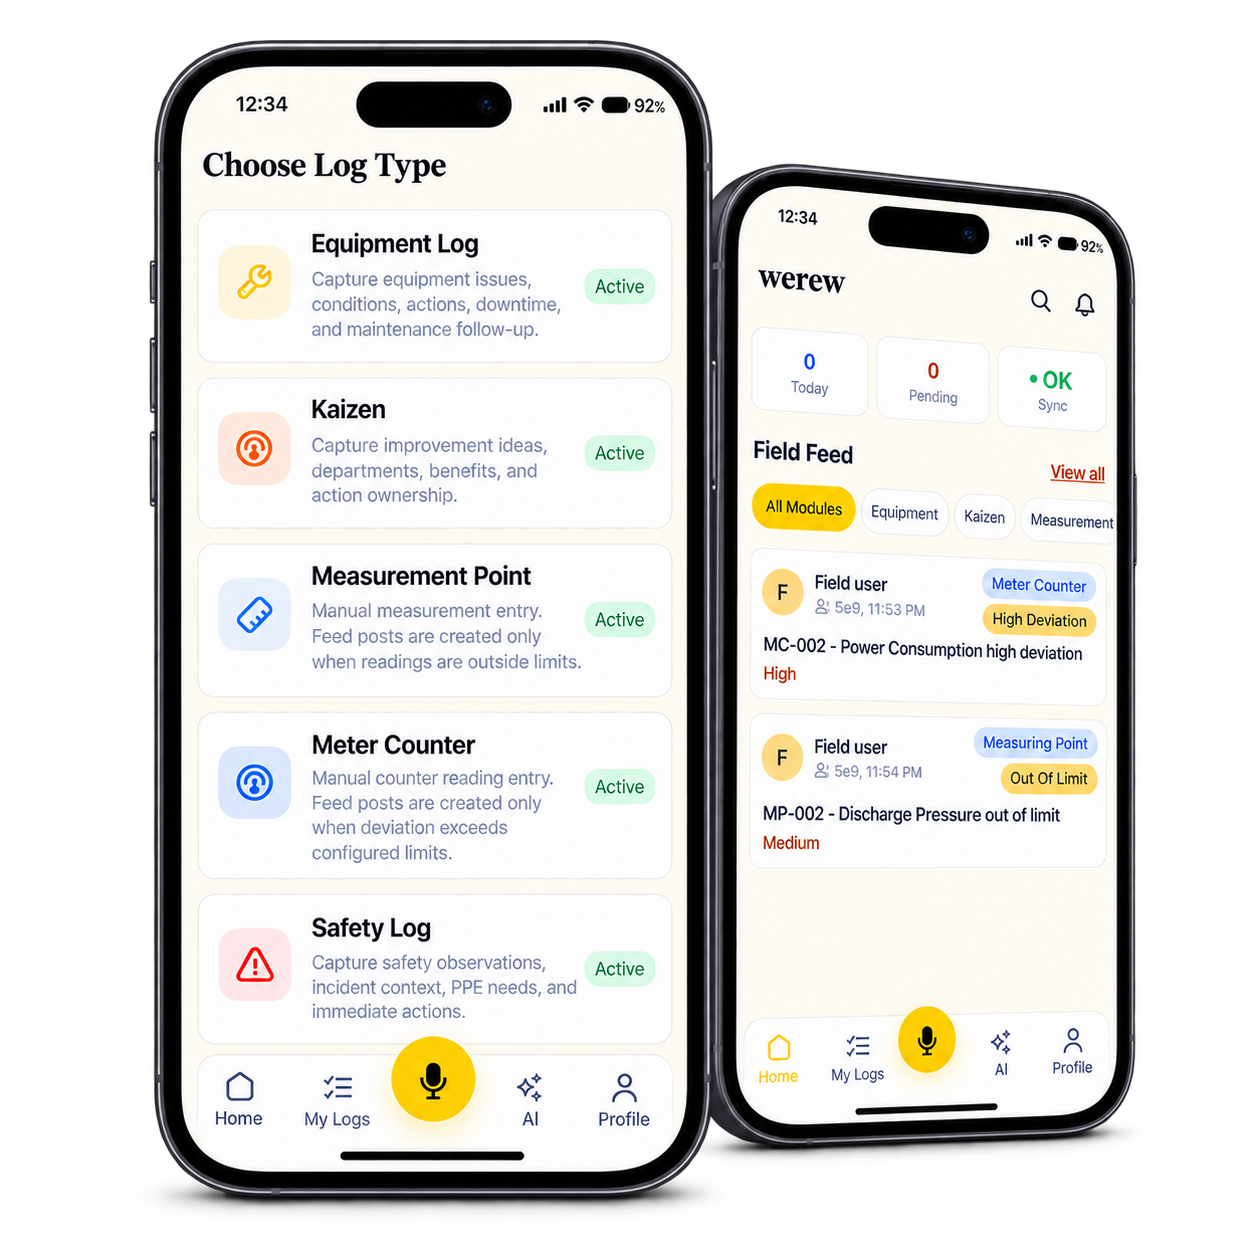
Industrial Operations & Voice-Assisted Mobile Field Logging Platform
UdhariPay
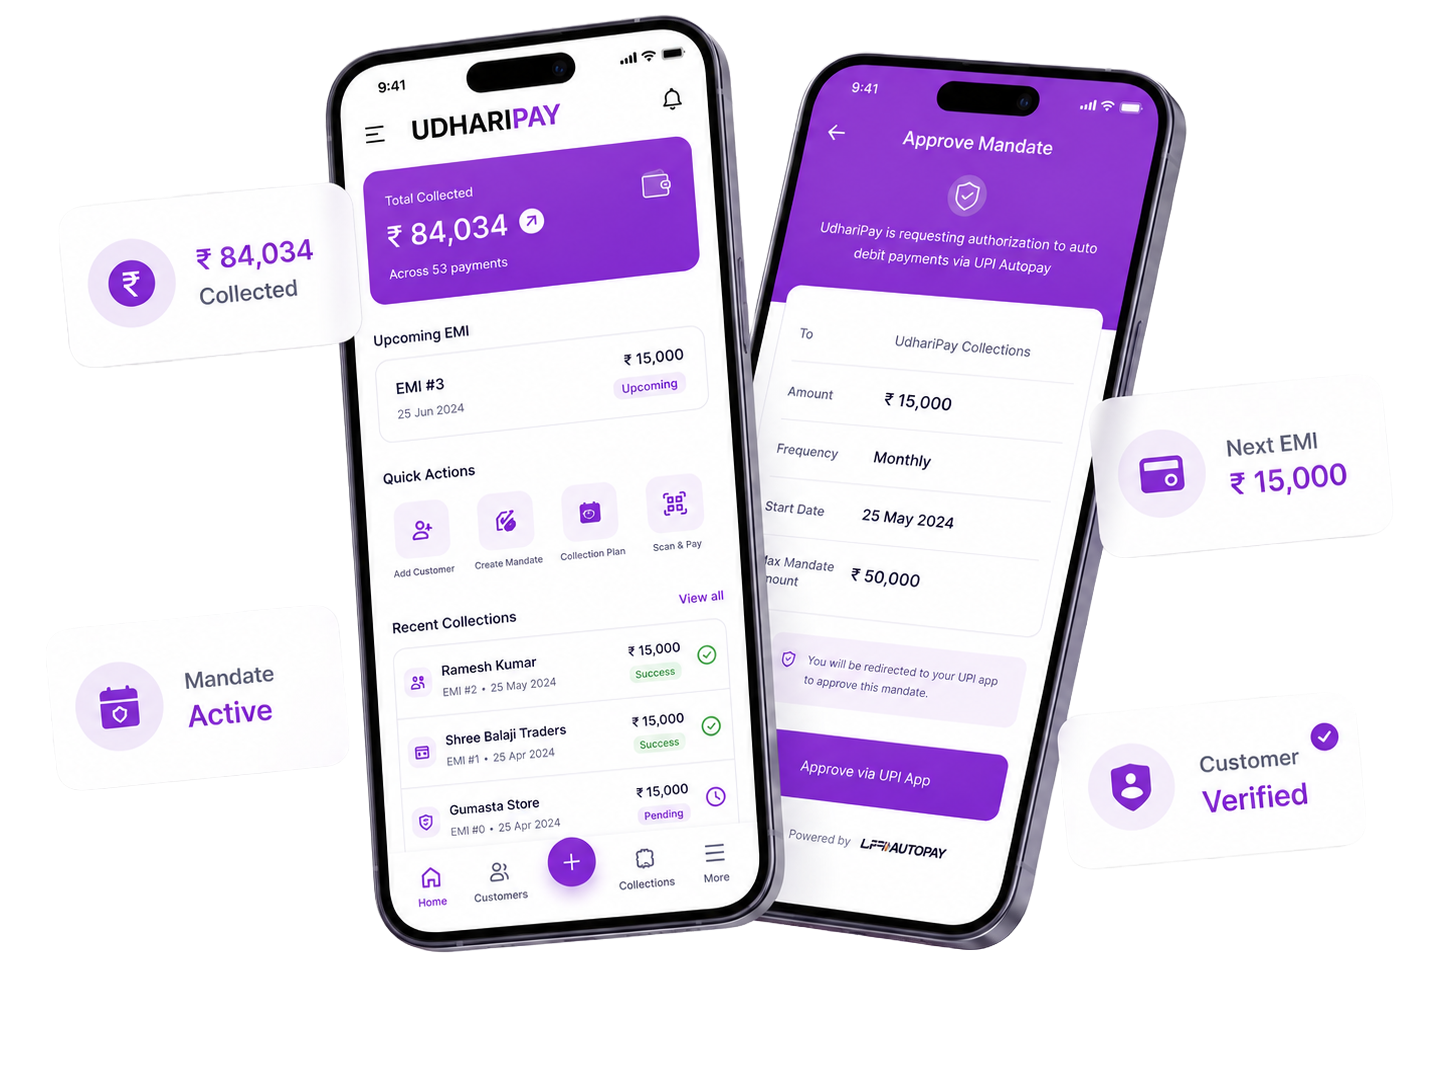
FinTech Digital Collections, Merchant Onboarding & UPI Autopay Mandate Platform
Inbox Pull
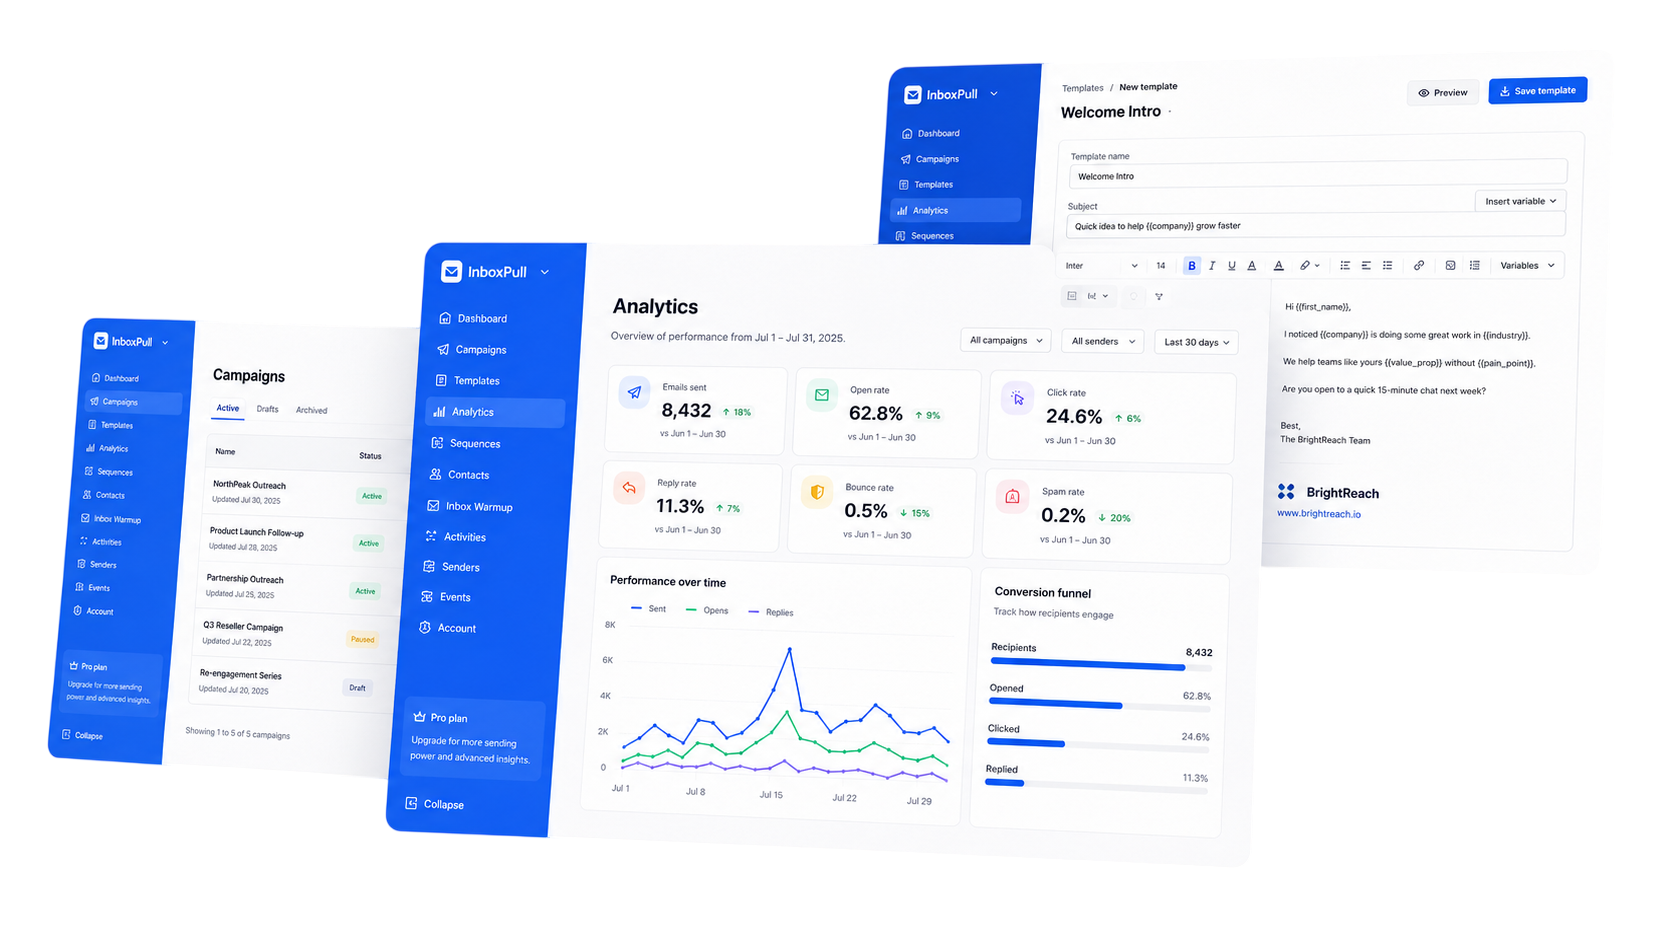
Gmail API SaaS Platform for Mailbox Ingestion, Campaign Sequencing & Funnel Analytics